
Financial Sustainability
LA Family Housing balances diverse revenue streams to support our work to end homelessness in people’s lives. Our revenue includes government contracts and private philanthropic support from a wide range of individual donors, foundations, and corporations, as well as earned revenue from our affordable housing properties and developer fees.
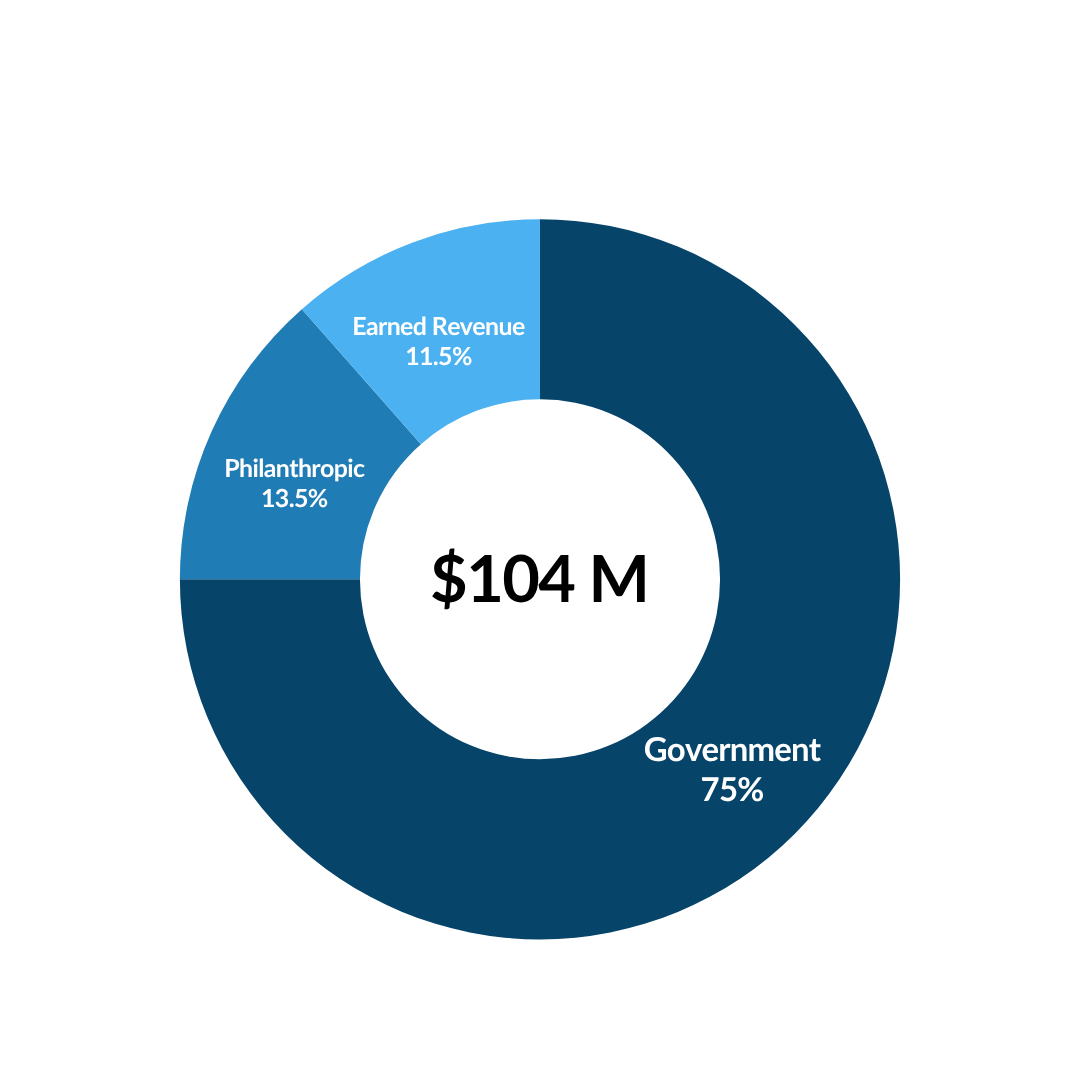
2024 Revenue Streams
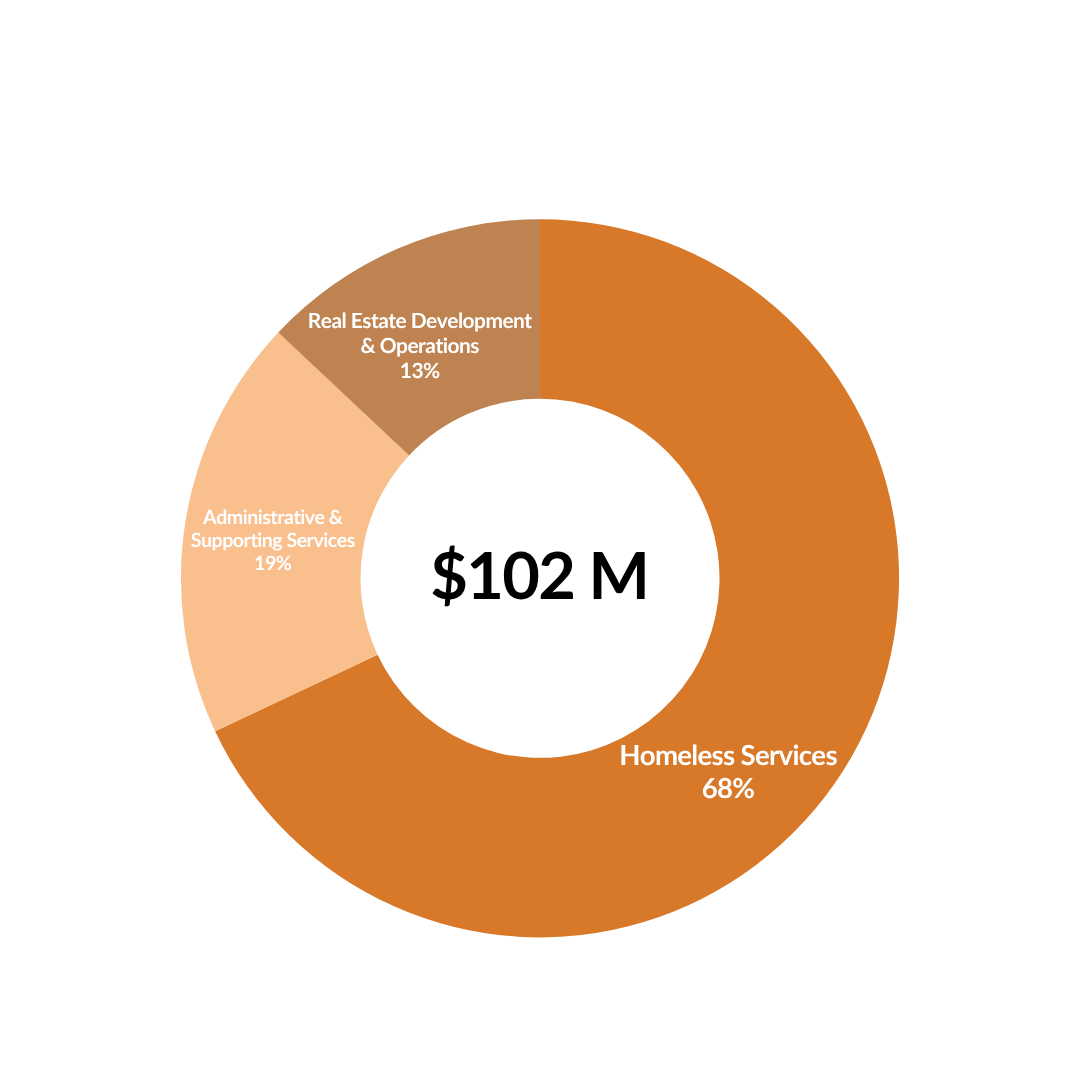
2024 Expense Distribution
STATEMENT OF FINANCIAL POSITION
ASSETS |
2024 |
2023 |
2022 |
| Cash & Cash Equivalents | $6,258,308 | $8,975,285 | $10,343,221 |
| Restricted Cash | $14,374,757 | $6,678,201 | $5,947,628 |
| Receivable, Net | $14,712,737 | $25,840,796 | $25,285,994 |
| Notes Receivable | $2,164,655 | $2,164,655 | $14,429,340 |
| Property and Equipment | $325,356,591 | $297,010,832 | $233,712,163 |
| Prepaid Expenses and Other Assets | $14,523,946 | $13,942,390 | $23,732,163 |
| TOTAL ASSETS | $377,390,994 | $354,612,159 | $313,450,509 |
LIABILITIES & NET ASSETS |
|||
| Accounts Payable | $25,200,792 | $20,045,915 | $25,229,292 |
| Notes Payable | $232,284,814 | $220,142,467 | $176,512,198 |
| Long Term Accrued Expenses | $21,155,433 | $21,379,078 | $19,070,770 |
| Other Liabilities | $15,841,360 | $19,594,419 | $16,725,689 |
| TOTAL LIABILITIES | $294,482,399 | $281,161,879 | $237,537,949 |
| Unrestricted | $57,474,903 | $48,925,723 | $51,251,872 |
| Donor Restricted | $25,433,692 | $24,524,557 | $24,660,688 |
| TOTAL NET ASSETS | $82,908,595 | $73,450,280 | $75,912,560 |
STATEMENT OF FINANCIAL ACTIVITIES
REVENUE |
2024 |
2023 |
2022 |
| Government Contracts | $77,651,313 | $65,145,048 | $70,773,593 |
| Private and In-Kind Contributions | $13,957,131 | $9,116,466 | $31,684,123 |
| Rental Revenue | $10,547,269 | $7,975,296 | $5,910,835 |
| Development Fees | $307,647 | $1,376,408 | $1,525,455 |
| Other Income (Investment income, gains on cancellation of debt) | $1,162,176 | $6,966,579 | $6,144,598 |
| TOTAL REVENUE | $103,625,536 | $90,579,797 | $116,038,604 |
EXPENSES |
2024 |
2023 |
2022 |
| Direct Services | $82,018,336 | $66,404,174 | $64,707,518 |
| Administrative Services | $19,864,006 | $23,109,173 | $16,998,147 |
| TOTAL BEFORE FINANCIAL EXPENSES | $101,882,342 | $89,513,347 | $81,705,665 |
| CHANGE IN NET ASSETS BEFORE FINANCIAL EXPENSES | $1,743,194 | $1,066,450 | $34,332,939 |
| Depreciation & Amortization Expense | $8,510,966 | $8,115,354 | $4,979,489 |
| Residual Receipt & Interest Expense | $5,449,913 | $2,731,877 | $2,400,914 |
TOTAL CHANGE IN NET ASSETS |
($12,217,685) |
($9,780,781) |
$26,952,536 |
Data is based on audited financial statements prepared by Holthouse, Carlin, and Van Trigt, LLP.